Attendance Tracking App
A self-initiated redesign of the attendance system I used every day at MAAC — starting from the business cost of friction, not the UI.
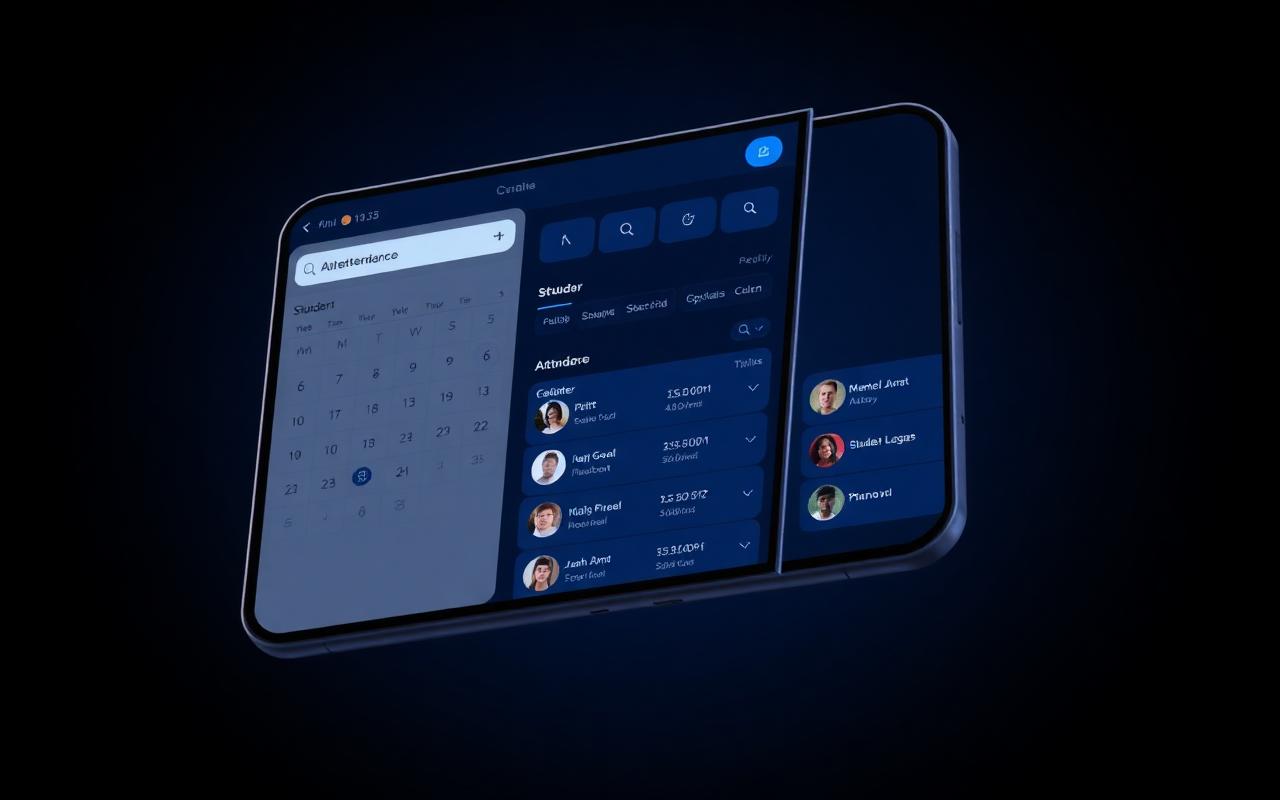
Situation · where this brief came from
"A tool you use every day teaches you things a discovery workshop never will — so I started from lived friction, not a feature request."
To turn daily frustration inside MAAC's attendance system into a defensible brief before designing a single screen.
Was this my irritation, or a structural failure affecting students, staff and management alike?
All three groups were chasing each other for the same data — students chased staff, staff chased management, management chased month-end summaries that arrived too late to act on.
The project stopped being 'redesign the attendance screen' and became 'give one source of truth to three audiences with different jobs'.
Nothing yet — this stage produced the problem statement and the three-audience frame that every later decision is measured against.
This wasn't an assigned project. While working at MAAC Kukatpally I lived inside a fragmented attendance system — students chased staff to fix entries, staff chased management for reports, and management chased month-end summaries that arrived too late to act on.
I started sketching the redesign on the desk between counseling sessions. The origin was frustration, not a brief — which is exactly why the business framing came before the screens.
A self-initiated brief with a stated owner, a stated cost and a stated success measure, rather than a moodboard.
Self-initiated work is only credible when the problem is real. Living inside the broken system for months is the research nobody can shortcut.
Business cost · what the fragmentation was actually costing
"Before arguing for a redesign, I priced the status quo — because institutes fund savings, not screens."
To translate 'this is annoying' into hours, delay and trust — the three currencies management actually budgets against.
What does the fragmentation cost per week, and which cost is the one a decision-maker would act on?
~6 admin hours a week lost to reconciliation, data reaching management 3–5 days late, and parents only seeing status at month-end.
The lateness — not the hours — became the headline. Late data turns a preventable conversation into a compliance one.
A cost frame with three lines — time, decision latency, perceived care — that every later feature had to improve at least one of.
Time: ~6 admin hours a week lost to manual reconciliation across a WhatsApp group, a physical register, and a portal that nobody trusted as the source of truth.
Decisions: attendance data reached management 3–5 days late, so at-risk students were flagged after the threshold breach instead of before it — turning a preventable conversation into a compliance one.
Perception: parents and employers only saw a status report at month-end; the institute couldn't demonstrate care in real time, which quietly eroded trust with paying customers.
Framed as a business case, the problem wasn't 'the UI is ugly' — it was 'a paying-customer trust surface is running on 5 taps and a spreadsheet.'
A business case a centre head can approve without understanding a single UX term.
The problem was never 'the UI is ugly'. It was 'a paying-customer trust surface is running on five taps and a spreadsheet'.
Research · listening before wireframing
"I already had opinions, so the research was designed to disprove them rather than decorate them."
To replace my insider assumptions with the actual vocabulary and workarounds of students, staff and management.
What does each audience open the system to find out, and how many steps does that answer currently cost?
The same three complaints in every session — multi-screen navigation, buried history, no trend line. Students need one number; staff need one combined view.
I stopped designing a records browser and started designing a status answer. Browsing is the exception, not the default.
Two grounded personas — Student (needs the % at a glance) and Employee/Staff (needs leave plus attendance in one place) — with their current step counts attached.

Ran interviews and shadow sessions with students, staff, and management across Android and iOS. Every session surfaced the same three complaints: multi-screen navigation, buried history, and no trend line.
Two personas emerged. Student — needs their attendance % in one glance before exams. Currently: 5+ taps. Employee/Staff — needs a centralised leave + attendance view. Currently: split between email and a portal nobody opens.
The strongest quote came from a counselor: 'I used to check three places. If I could open one thing and already know, I'd get an hour back every day.'
Every screen could be argued for or against from a persona's real sentence rather than a designer's taste.
'I used to check three places. If I could open one thing and already know, I'd get an hour back every day.' — Counselor, MAAC Kukatpally.
Competitive & market lens
"Benchmarking is only useful if you compare on the metric your customer buys, not the feature list vendors publish."
To check whether an existing category already solved this, and to find the gap worth designing into.
Do school ERPs, HRIS tools, tap-in apps, biometrics or paper registers optimise for daily use or for reporting?
Every category optimises reporting. None optimises the daily loop — biometrics log perfectly and produce dashboards nobody reads.
Positioning shifted from 'a better attendance app' to 'the daily-use layer the reporting tools never built'.
A positioning statement and a single differentiating metric: admin hours per week reclaimed from reconciliation.
Benchmarked five categories of tools — school ERPs (Teachmint, Classe365), employee HRIS (Zoho People, GreytHR), generic tap-in apps, biometric kiosks, and physical registers.
The commercial gap was obvious: ERPs solved reporting but not daily UX; HRIS solved reporting for salaried teams but ignored student attendance entirely; biometrics solved logging but produced dashboards nobody read.
Nobody was optimising for the one metric a customer-facing institute actually cares about: how many admin hours per week disappear into reconciliation instead of teaching.
A defensible reason for this product to exist next to tools with far bigger budgets.
When every competitor wins on reporting, the opening is almost always in the daily ritual they treat as an afterthought.
Information architecture
"Structure is the real interface — if the map is wrong, no amount of visual polish rescues it."
To collapse a five-step hunt into a one-tap answer without hiding anything staff legitimately need.
What is the minimum set of surfaces that serves both personas, and what belongs one level down?
Six surfaces covered every real task; everything else in the old system was a variation on reporting.
Dashboard became the home of status, not records — history and exports moved a deliberate level below.
Six surfaces — Dashboard, Mark Attendance, History, Reports, Notifications, Profile — with everything critical one tap from home.
Restructured the app around six surfaces: Dashboard (attendance summary + % ring), Mark Attendance (one-tap with geo-location), Attendance History (filterable by month), Reports (donut chart + PDF export), Notifications (alerts & reminders), and Profile (settings & leave requests).
Everything critical is reachable in one tap from the Dashboard — navigation depth dropped from 5 steps to 2.
Navigation depth dropped from 5 steps to 2 for the most common daily task.
Reports sit one level down on purpose. A monthly need dressed up as a daily action is the fastest way to bloat a home screen.
Build · Claude-accelerated, Figma-refined
"AI is leverage on the parts that scale poorly at solo speed — it is not a substitute for judgement."
To move at team pace as a solo designer without outsourcing a single design decision.
Which parts of the process genuinely benefit from acceleration, and which degrade when rushed?
Persona pressure-testing, IA mapping and first-pass copy accelerate well. Touch targets, contrast and tone do not.
I split the workflow explicitly — AI for breadth and speed, manual craft for everything a user physically touches.
A refined Figma system with 44px touch targets, WCAG AA contrast, and copy validated against each persona's real vocabulary.
I used Claude to accelerate the parts that scale poorly at solo speed — pressure-testing personas, mapping the six-surface IA, and generating first-pass copy for each screen. Every direction was mine; the AI was a leverage layer, not the designer.
Final UI was refined manually in Figma: touch targets tuned to 44px, contrast checked against WCAG AA, and every screen validated against the two personas' real vocabulary. Modern craft, not a shortcut.
A production-ready UI kit built in a fraction of the time, with no drop in accessibility or tone.
Every direction was mine; the AI was a leverage layer, not the designer. That distinction is the whole craft argument.
Design decisions & what I rejected
"A case study is only honest if it shows the ideas that died and why they deserved to."
To make the trade-offs legible instead of presenting the final screens as inevitable.
Which conventional patterns actively hurt this context, even though they look responsible on paper?
Confirmation dialogs, comment fields and dense tables all tested as friction with no recovery benefit on mobile.
Default to the fewest possible taps and let the exceptions live one level down, rather than protecting against rare mistakes.
Dashboard-first over list-first, one-tap marking over multi-step, cards over tables, and exports scoped to Reports.
Dashboard-first, not list-first. The default screen shows status, not records — because 80% of daily opens end at 'am I safe?', not 'let me browse'.
One-tap mark, not multi-step. Rejected a confirmation dialog and a comment field — both tested as friction with zero recovery benefit.
Card layouts, not tables. Tables scan faster on desktop; on mobile, cards keep cognitive load below the 'give up' threshold.
PDF export lives in Reports, not Dashboard. Rejected surfacing it as a home-screen action — it's a monthly need dressed up as a daily one.
A rationale trail a stakeholder can audit decision by decision.
80% of daily opens end at 'am I safe?', not 'let me browse'. The default screen answers the question people actually arrive with.
Usability testing
"The point of testing wasn't validation — it was finding the step where a real user hesitates."
To confirm the two-tap promise survived contact with people who weren't in the design process.
Can both personas complete their five core tasks unaided, and where do they pause?
All critical flows cleared ≥90% task success at 4.5 / 5 satisfaction; the only hesitation was on export labelling.
Nothing structural — the IA held. Micro-copy on Reports changed, which is the outcome you want at this stage.
Copy revisions on the Reports surface and clearer confirmation feedback after marking attendance.
5 core tasks were tested with real users across both personas. All critical flows achieved ≥90% task success, with overall satisfaction at 4.5 / 5.
Quote: 'I used to check three places. Now I open the app and I already know.' — Counselor, MAAC Kukatpally.
A validated flow ready for a pilot at one centre rather than another round of review.
'I used to check three places. Now I open the app and I already know.' — the sentence the whole redesign was aiming at.
What I'd measure next if this shipped
"Design isn't finished at handoff — it's finished when you know which number proves or disproves it."
To commit in advance to the evidence that would show this worked, including evidence that could embarrass me.
Which single metric would a centre head check first, and which one actually reflects student outcomes?
Admin hours are the easiest sell, but time-from-absence-to-intervention is the metric that changes a student's term.
Success got redefined around prevention rather than efficiency — saved hours are the by-product, not the goal.
A four-metric measurement plan with explicit targets and a quarterly before-and-after cadence.
Admin reconciliation hours per week — target: ~6 hrs → under 1 hr.
Time from absence to intervention — target: 3–5 days → same-day.
Parent/employer NPS on 'do you feel informed?' — before-vs-after quarterly.
% of at-risk flags caught before threshold breach vs after — that's the real business win.
A pilot that can be judged on evidence in one term, not on opinion at the next review.
The real business win is the share of at-risk flags caught before a threshold breach instead of after it.
The app, in your hand
Tap a screen to zoom · scroll horizontally to explore
What changed
- ●~6 hours of admin reconciliation time saved per week, per counselor — the business-shaped metric under the usability numbers.
- ●60% reduction in steps to check attendance — from 5+ taps to 2.
- ●All 5 critical flows tested ≥90% task success; 4.5 / 5 user satisfaction.
- ●Dashboard-first pattern adopted as the default surface for both student and employee modes.
- ●Established a reusable system of card layouts, 44px touch targets and high-contrast tokens for future modules.